Summary

Campaign Overview is the main dashboard in Teads Ad Manager. Advertisers and account managers open it by clicking a campaign in their campaign list, to check its metrics. As the platform grew from video only to many ad formats, the KPI matrix grew with it and the chart-led layout stopped keeping up. I led the redesign as the only designer, working with the main Ad Manager team's engineers and PM from requirements to delivery.

  • Role

    Senior Product Designer, sole designer

  • Team

    1 Product Designer, 3 Engineers, 1 PM

  • Deliverables

    Research, four redesign rounds, UI design

  • Impact

    Became the backbone for the future metrics overview. The old interface limited the campaign structure, and the new design hosts multiple chart types like funnels and a different table structure.

01 The problem:

The KPIs outgrew the page

Which metrics apply depends on the line type and buying mode, such as CPM and CPCV, and the old dashboard had no way to express that. We could keep adding rows and labels, but the page would only get harder to read.

  1. A more complex KPI matrix than the old structure could show.
  2. No simple way to compare two KPIs over time.
  3. No way to edit a line or creative without leaving the page.
  4. Campaigns with hundreds of lines were hard to navigate.

Interface before:

Campaign Overview

Line Overview

02 What interviews showed

I talked to account managers, traders, planners and sales teams. The same things kept coming up.

  • People skipped the chart.

    They went straight to the table for analysis.

  • Comparing two KPIs.

    This was the most common task and the hardest one.

  • Editing in place.

    A full makeover could slow them down.

  • Filtering.

    Campaigns with hundreds of lines needed it, not more scrolling.

03 The decision

Power users need scalability and beginners scanability

Moving from a chart-led layout to a table-led one was not the direction the team had assumed. I pushed for it. The first two redesigns tried to stretch the old structure and failed, which made the case for starting again. I also compared how Mixpanel, Google Analytics, Snapchat Ads and Facebook Ads Manager handle similar problems before committing.

​

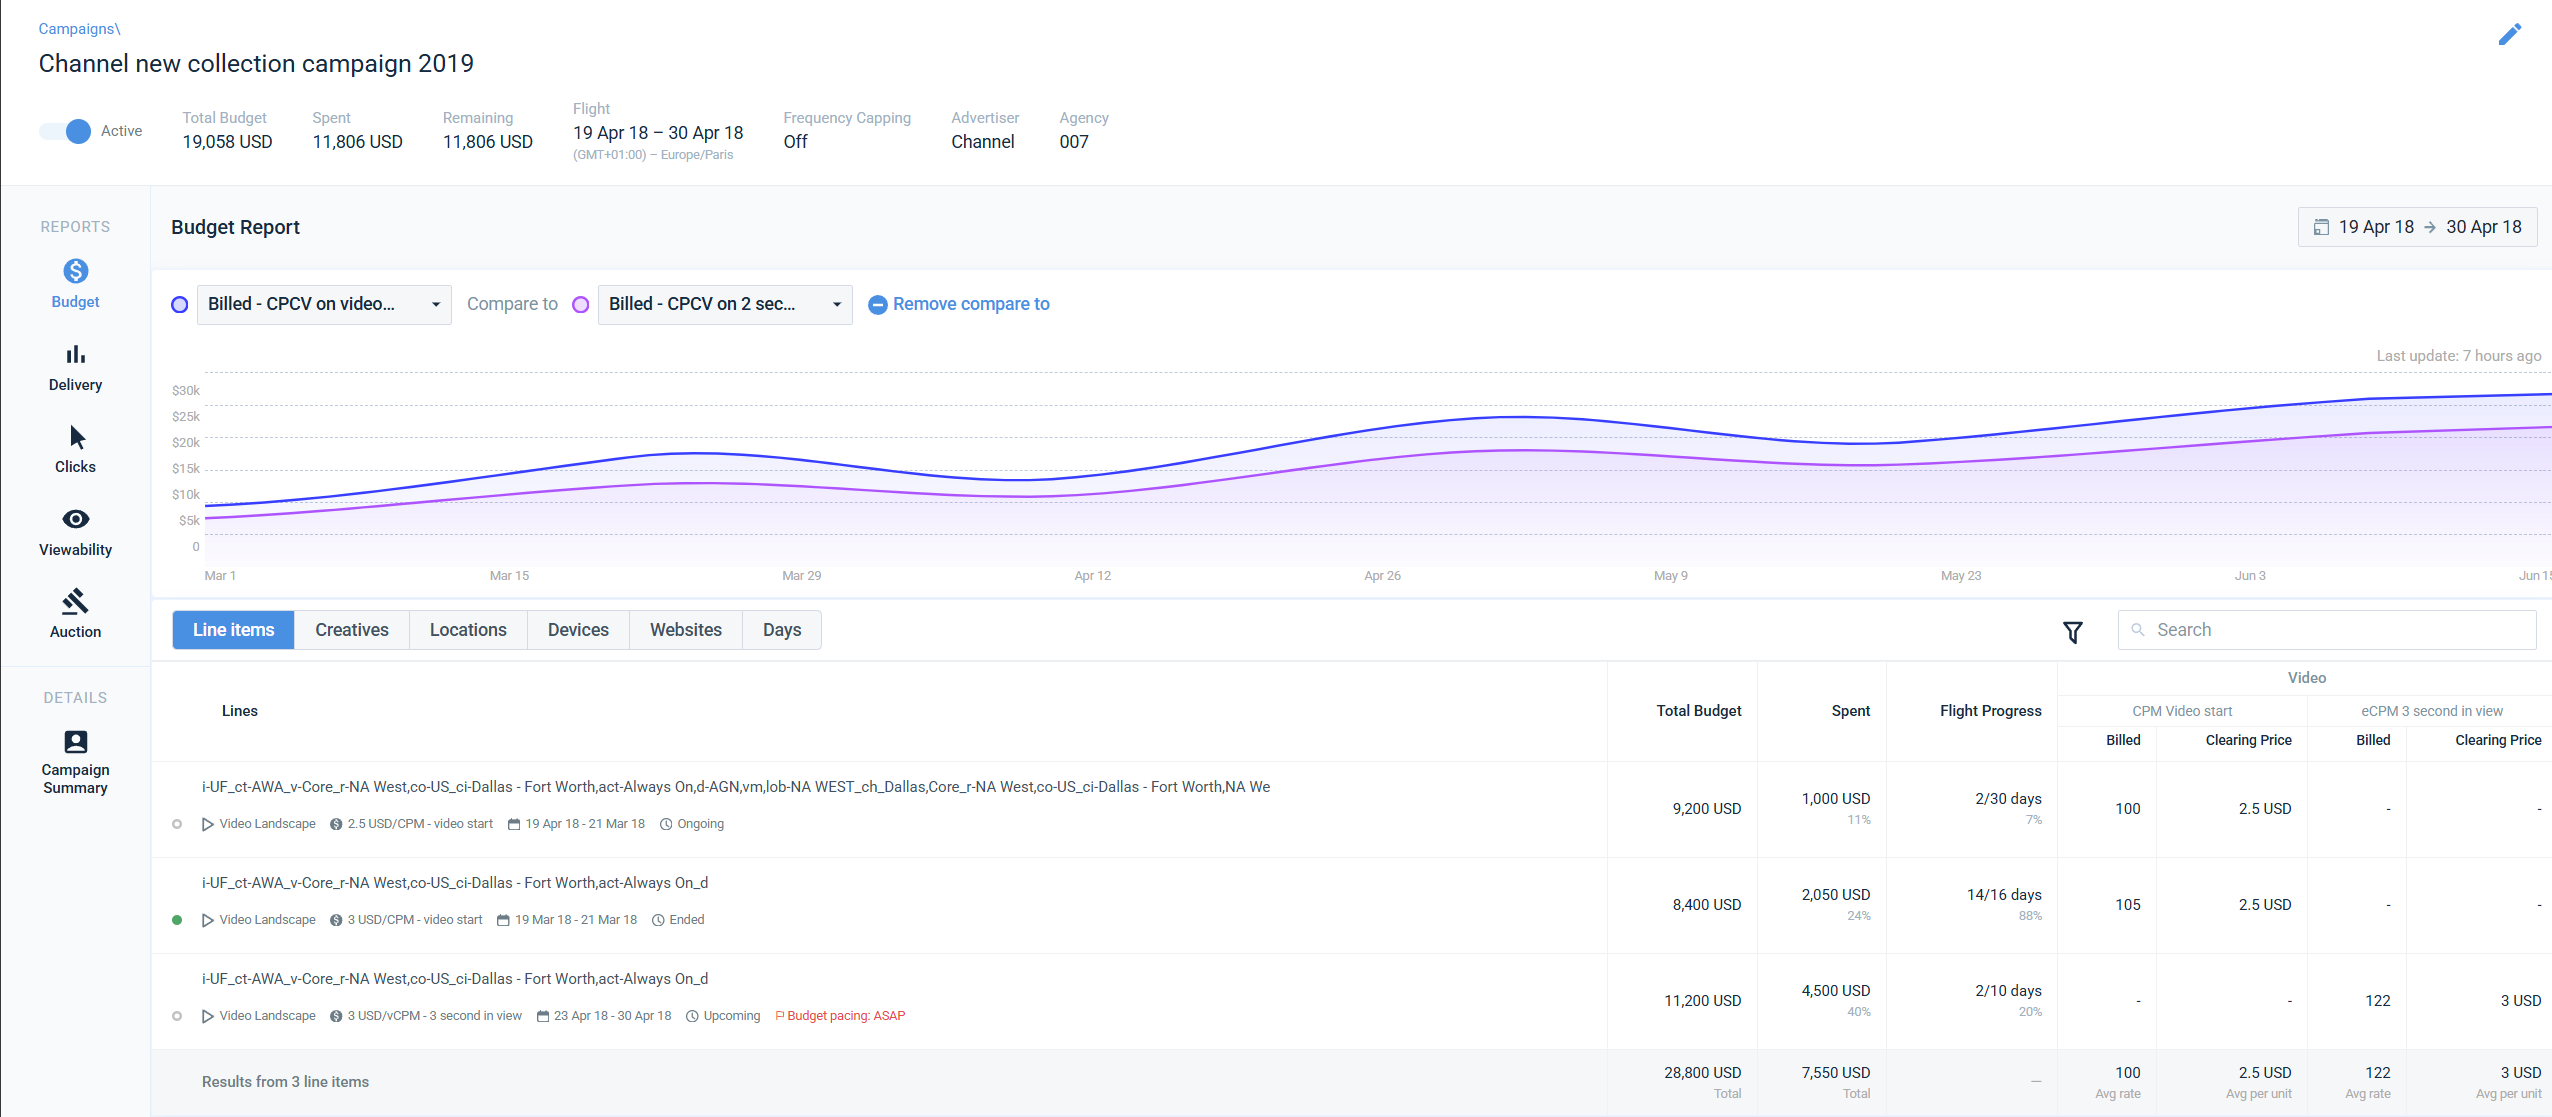
  1. Table first. A filterable table is the main interface, with buying mode KPI splits shown in the cells.
  2. Chart in support. A smaller trend chart shows two KPIs at a time and supports the table.
  3. Flexible structure. The old interface limited the campaign structure. The new one can host other chart types, like funnels, and a different table structure.
  4. Built for large campaigns. My general rule in Ad Manager is to design for edge cases like 100+ lines and very long names. I redesigned the table and added search, status and other filters to find lines and creatives faster.
  5. Timeline comparison. Any two KPIs can be compared over time, the most requested feature in the interviews.

04 Four rounds of iteration

Making room for more KPIs without losing clarity

Round one: the objective selector and guidance.

Round two: Letting go of the old structure and exploring expandable lines for quick edit

I redesigned the table, added filters and search, and split the main chart into three mini charts: pacing progress, bid health, and a positive and negative chart template showing the average and its trend, to see if a campaign performs better than others.

Round three: Lines and chart in two tabs

I explored expandable lines that show the line setup and allow quick edits to some settings, and I separated the chart from the table into two tabs: lines in the main tab, the chart in a secondary one.

Round four: Harmony between the data visualizations and data tables

I put the chart and table back on the same page, with a slightly smaller chart where users can compare two KPIs. Lines are still expandable, but without quick edits: there is a main edit button and a campaign summary button that shows the whole campaign setup, plus some expanded total results.

Loading state: Mitigating Latency with Gradual Loading

High fidelity prototype

05 A deliberate trade-off

Power users need scalability and beginners scanability

Inline editing for status, budget, capping and pacing went to a follow-up phase, so the core architecture could ship on time. Metadata on lines and creatives did ship, for high-volume campaigns.

06 The outcome

The backbone for the future metrics overview.

It became the default view people open to check campaign performance, used by self-serve advertisers and internal teams. It later shaped how a few other reporting views were structured. It also supported the platform's move from 20% to 90% self-serve, and account managers spent less time answering basic questions.

07 Looking back

Power users need scalability and beginners scanability

The first two redesigns tried to stretch the old structure and didn't work, but they were useful. They were the proof I needed to rethink the page from scratch.

Got a complex product that needs structure? Let's talk.

Summary

Campaign Overview is the main dashboard in Teads Ad Manager. Advertisers and account managers open it by clicking a campaign in their campaign list, to check its metrics. As the platform grew from video only to many ad formats, the KPI matrix grew with it and the chart-led layout stopped keeping up. I led the redesign as the only designer, working with the main Ad Manager team's engineers and PM from requirements to delivery.

  • Role

    Senior Product Designer, sole designer

  • Team

    1 Product Designer, 3 Engineers, 1 PM

  • Deliverables

    Research, four redesign rounds, UI design

  • Impact

    Became the backbone for the future metrics overview. The old interface limited the campaign structure, and the new design hosts multiple chart types like funnels and a different table structure.

01 The problem:

The KPIs outgrew the page

Which metrics apply depends on the line type and buying mode, such as CPM and CPCV, and the old dashboard had no way to express that. We could keep adding rows and labels, but the page would only get harder to read.

  1. A more complex KPI matrix than the old structure could show.
  2. No simple way to compare two KPIs over time.
  3. No way to edit a line or creative without leaving the page.
  4. Campaigns with hundreds of lines were hard to navigate.

Interface before:

Campaign Overview

Line Overview

02 What interviews showed

I talked to account managers, traders, planners and sales teams. The same things kept coming up.

  • People skipped the chart.

    They went straight to the table for analysis.

  • Comparing two KPIs.

    This was the most common task and the hardest one.

  • Editing in place.

    A full makeover could slow them down.

  • Filtering.

    Campaigns with hundreds of lines needed it, not more scrolling.

03 The decision

Power users need scalability and beginners scanability

Moving from a chart-led layout to a table-led one was not the direction the team had assumed. I pushed for it. The first two redesigns tried to stretch the old structure and failed, which made the case for starting again. I also compared how Mixpanel, Google Analytics, Snapchat Ads and Facebook Ads Manager handle similar problems before committing.

​

  1. Table first. A filterable table is the main interface, with buying mode KPI splits shown in the cells.
  2. Chart in support. A smaller trend chart shows two KPIs at a time and supports the table.
  3. Flexible structure. The old interface limited the campaign structure. The new one can host other chart types, like funnels, and a different table structure.
  4. Built for large campaigns. My general rule in Ad Manager is to design for edge cases like 100+ lines and very long names. I redesigned the table and added search, status and other filters to find lines and creatives faster.
  5. Timeline comparison. Any two KPIs can be compared over time, the most requested feature in the interviews.

04 Four rounds of iteration

Making room for more KPIs without losing clarity

Round one: the objective selector and guidance.

Round two: Letting go of the old structure and exploring expandable lines for quick edit

I redesigned the table, added filters and search, and split the main chart into three mini charts: pacing progress, bid health, and a positive and negative chart template showing the average and its trend, to see if a campaign performs better than others.

Round three: Lines and chart in two tabs

I explored expandable lines that show the line setup and allow quick edits to some settings, and I separated the chart from the table into two tabs: lines in the main tab, the chart in a secondary one.

Round four: Harmony between the data visualizations and data tables

I put the chart and table back on the same page, with a slightly smaller chart where users can compare two KPIs. Lines are still expandable, but without quick edits: there is a main edit button and a campaign summary button that shows the whole campaign setup, plus some expanded total results.

Loading state: Mitigating Latency with Gradual Loading

High fidelity prototype

05 A deliberate trade-off

Power users need scalability and beginners scanability

Inline editing for status, budget, capping and pacing went to a follow-up phase, so the core architecture could ship on time. Metadata on lines and creatives did ship, for high-volume campaigns.

06 The outcome

The backbone for the future metrics overview.

It became the default view people open to check campaign performance, used by self-serve advertisers and internal teams. It later shaped how a few other reporting views were structured. It also supported the platform's move from 20% to 90% self-serve, and account managers spent less time answering basic questions.

07 Looking back

Power users need scalability and beginners scanability

The first two redesigns tried to stretch the old structure and didn't work, but they were useful. They were the proof I needed to rethink the page from scratch.

Got a complex product that needs structure? Let's talk.

Summary

Campaign Overview is the main dashboard in Teads Ad Manager. Advertisers and account managers open it by clicking a campaign in their campaign list, to check its metrics. As the platform grew from video only to many ad formats, the KPI matrix grew with it and the chart-led layout stopped keeping up. I led the redesign as the only designer, working with the main Ad Manager team's engineers and PM from requirements to delivery.

  • Role

    Senior Product Designer, sole designer

  • Team

    1 Product Designer, 3 Engineers, 1 PM

  • Deliverables

    Research, four redesign rounds, UI design

  • Impact

    Became the backbone for the future metrics overview. The old interface limited the campaign structure, and the new design hosts multiple chart types like funnels and a different table structure.

01 The problem:

The KPIs outgrew the page

Which metrics apply depends on the line type and buying mode, such as CPM and CPCV, and the old dashboard had no way to express that. We could keep adding rows and labels, but the page would only get harder to read.

  1. A more complex KPI matrix than the old structure could show.
  2. No simple way to compare two KPIs over time.
  3. No way to edit a line or creative without leaving the page.
  4. Campaigns with hundreds of lines were hard to navigate.

Interface before:

Campaign Overview

Line Overview

02 What interviews showed

I talked to account managers, traders, planners and sales teams. The same things kept coming up.

  • FINDING 1

    People skipped the chart.

    They went straight to the table for analysis.

  • FINDING 2

    Comparing two KPIs.

    This was the most common task and the hardest one.

  • FINDING 3

    Editing in place.

    Changing a line or creative without leaving was a frequent ask.

  • FINDING 4

    Filtering.

    Campaigns with hundreds of lines needed it, not more scrolling.

03 The decision

Table first, chart in support

Moving from a chart-led layout to a table-led one was not the direction the team had assumed. I pushed for it. The first two redesigns tried to stretch the old structure and failed, which made the case for starting again. I also compared how Mixpanel, Google Analytics, Snapchat Ads and Facebook Ads Manager handle similar problems before committing.

​

  1. Table first. A filterable table is the main interface, with buying mode KPI splits shown in the cells.
  2. Chart in support. A smaller trend chart shows two KPIs at a time and supports the table.
  3. Flexible structure. The old interface limited the campaign structure. The new one can host other chart types, like funnels, and a different table structure.
  4. Built for large campaigns. My general rule in Ad Manager is to design for edge cases like 100+ lines and very long names. I redesigned the table and added search, status and other filters to find lines and creatives faster.
  5. Timeline comparison. Any two KPIs can be compared over time, the most requested feature in the interviews.

04 Four rounds of iteration

Making room for more KPIs without losing clarity

Round one: Adding the new KPIs to the old structure

Round two: Letting go of the old structure and exploring expandable lines for quick edit

I redesigned the table, added filters and search, and split the main chart into three mini charts: pacing progress, bid health, and a positive and negative chart template showing the average and its trend, to see if a campaign performs better than others.

Round three: Lines and chart in two tabs

I explored expandable lines that show the line setup and allow quick edits to some settings, and I separated the chart from the table into two tabs: lines in the main tab, the chart in a secondary one.

Round four: Harmony between the data visualizations and data tables

I put the chart and table back on the same page, with a slightly smaller chart where users can compare two KPIs. Lines are still expandable, but without quick edits: there is a main edit button and a campaign summary button that shows the whole campaign setup, plus some expanded total results.

Loading state: Mitigating Latency with Gradual Loading

High fidelity prototype

05 A deliberate trade-off

Shipping the new architecture on time

Inline editing for status, budget, capping and pacing went to a follow-up phase, so the core architecture could ship on time. Metadata on lines and creatives did ship, for high-volume campaigns.

06 The outcome

The backbone for the future metrics overview.

It became the default view people open to check campaign performance, used by self-serve advertisers and internal teams. It later shaped how a few other reporting views were structured. It also supported the platform's move from 20% to 90% self-serve, and account managers spent less time answering basic questions.

07 Looking back

Failing Fast to Build the Right Foundation

The first two redesigns tried to stretch the old structure and didn't work, but they were useful. They were the proof I needed to rethink the page from scratch.

Got a complex product that needs structure? Let's talk.