Summary
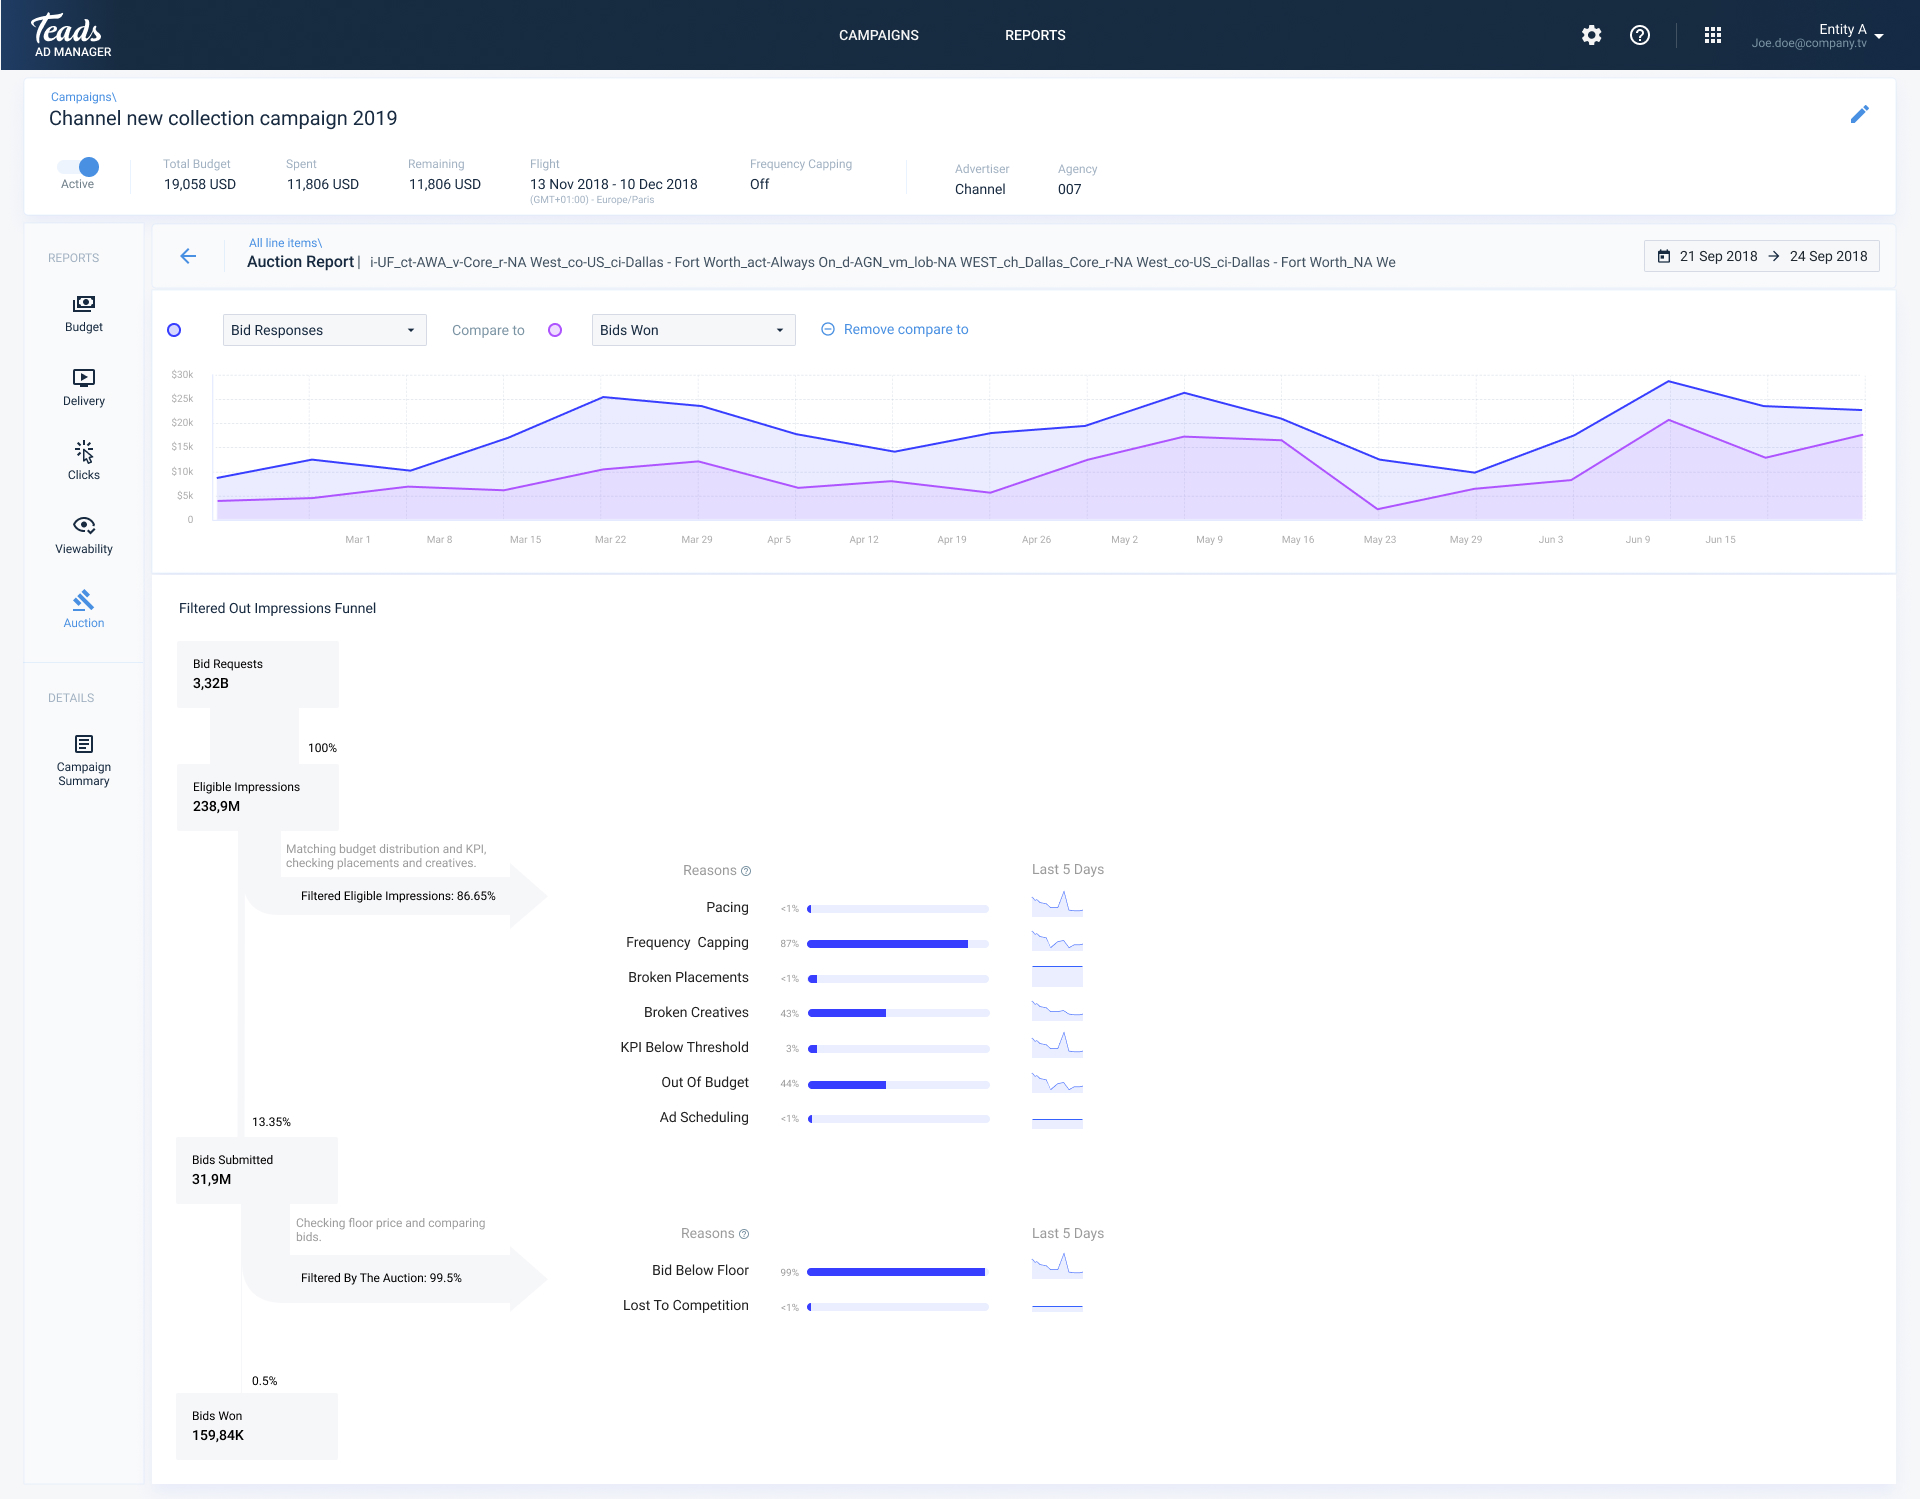
Before this existed, finding out why a campaign was underdelivering usually meant opening a support ticket and waiting on an account manager. The Auction Report gives self-serve advertisers a direct breakdown of why ad opportunities were lost, including whether their bid was simply too low, which is one of the most common and most fixable reasons.
Challenge
The auction funnel is technically dense, and most of that complexity isn't meaningful to someone who isn't a data analyst.
Approach
A visual funnel from opportunity to delivery, with bid competitiveness as one of several clear, ranked reasons.
Result
Advertisers could diagnose delivery issues themselves and act on the most common one, low bids, without contacting support.
The Challenge
There are several reasons an ad opportunity can be lost: bid price, targeting mismatches, creative performance. Showing all of them clearly, without burying the advertiser in detail, took six internal design iterations before it actually worked.
What I found
I ran a competitive look at how Google Ads, DV360 and others handled auction level reporting, plus discovery sessions with account managers who answered delivery questions every day:
💡
Advertisers rarely knew which lever to pull first when delivery was low
💡
The funnel needed to be visual, not just tabular, to make drop off points easy to read at a glance
💡
Too much detail caused paralysis, too little felt useless, the balance mattered more than the depth
Main problems
Delivery visibility
No way for advertisers to see why their ads weren't delivering without contacting support
Bid competition
Bid competitiveness, the most common and most actionable cause, wasn't visible anywhere
Accessibility
The auction funnel itself wasn't represented in a way non-technical users could read
My Role
I was the sole designer responsible for making auction level data legible to a non-technical audience, working closely with the PM and engineering on what to include and, just as important, what to leave out. We ran six internal reviews before landing on the final structure.
How it came together
I explored five different structural approaches, each with a different balance of chart types and detail. The question I kept coming back to was simple: can an advertiser read this and know exactly what to fix? The direction that answered that clearly is the one we shipped.
Design iteration
V1
V2
V3
V4
V5
What shipped
- A funnel visualization showing the full path from opportunity to delivery, with drop off points visible at a glance
- A breakdown of lost opportunities by reason: budget, bid, targeting, frequency caps
- Bid competitiveness shown as one of several diagnostic signals, not the only one
- A time series view to track auction performance over the life of a campaign
- A loading state designed for the longer than usual data retrieval times, so the wait itself didn't feel broken
High-fidelity UI
Action report by lines
Auction funnel
Loading state
Impact
This removed line by line editing for high volume campaigns and gave agencies a direct bridge between their existing Excel workflows and the platform. It was later extended to creatives too, using the same interaction model.
Looking back
The best solution here didn't come from the design team alone. I came into a brainstorming session with a set of constraints I assumed were fixed, and a developer changed that in one conversation. Worth remembering: hold your technical assumptions loosely.